Logs
Grafana Loki
Starting with this writeup we are given a good idea at why this is a good idea. Plus I need to debug some stuff that I lose logs for when pods restart.
Roadblocks w/ Funky FLux
Now that I am using flux all the steps need to be adapted to follow how this repository structures the helm stuff. I may want to run though a few more examples or pivot to ansible.
However, flux has an example for loki-stack so we may be cooking with gas.
Going For It
After pulling namespaces, repos, and the cluster file (into the main kustomizations folder) up to the the generic folders I copied the monitoring folder to root and gave it a whirl. This command let me see it go up:
flux get kustomizations --watch
It didn’t look great:
thaynes@kubevip:~$ flux get kustomizations --watch
NAME       	REVISION          	SUSPENDED	READY	MESSAGE
flux-system	main@sha1:c4117618	False    	True 	Applied revision: main@sha1:c4117618
podinfo	main@sha1:c4117618	False	True	Applied revision: main@sha1:c4117618
sealed-secrets	main@sha1:c4117618	False	True	Applied revision: main@sha1:c4117618
velero		False	False	health check failed after 10.633098ms: failed early due to stalled resources: [HelmRelease/velero/velero status: 'Failed']
velero		False	Unknown	Reconciliation in progress
podinfo	main@sha1:c4117618	False	Unknown	Reconciliation in progress
sealed-secrets	main@sha1:c4117618	False	Unknown	Reconciliation in progress
flux-system	main@sha1:c4117618	False	Unknown	Reconciliation in progress
velero		False	Unknown	Reconciliation in progress
podinfo	main@sha1:c4117618	False	Unknown	Reconciliation in progress
podinfo	main@sha1:c4117618	False	Unknown	Reconciliation in progress
sealed-secrets	main@sha1:c4117618	False	Unknown	Reconciliation in progress
velero		False	Unknown	Reconciliation in progress
flux-system	main@sha1:c4117618	False	Unknown	Reconciliation in progress
sealed-secrets	main@sha1:c4117618	False	Unknown	Reconciliation in progress
flux-system	main@sha1:c4117618	False	Unknown	Reconciliation in progress
velero		False	Unknown	Reconciliation in progress
sealed-secrets	main@sha1:c4117618	False	Unknown	Reconciliation in progress
podinfo	main@sha1:c4117618	False	Unknown	Reconciliation in progress
sealed-secrets	main@sha1:c4117618	False	Unknown	Reconciliation in progress
velero		False	Unknown	Reconciliation in progress
flux-system	main@sha1:c4117618	False	Unknown	Reconciliation in progress
podinfo	main@sha1:c4117618	False	Unknown	Reconciliation in progress
sealed-secrets	main@sha1:c4117618	False	Unknown	Reconciliation in progress
velero		False	False	health check failed after 112.84562ms: failed early due to stalled resources: [HelmRelease/velero/velero status: 'Failed']
sealed-secrets	main@sha1:c4117618	False	True	Applied revision: main@sha1:589e0c74
sealed-secrets	main@sha1:589e0c74	False	True	Applied revision: main@sha1:589e0c74
podinfo	main@sha1:c4117618	False	Unknown	Reconciliation in progress
podinfo	main@sha1:c4117618	False	True	Applied revision: main@sha1:589e0c74
podinfo	main@sha1:589e0c74	False	True	Applied revision: main@sha1:589e0c74
flux-system	main@sha1:c4117618	False	False	HelmRepository/grafana-charts namespace not specified: the server could not find the requested resource (patch helmrepositories.source.toolkit.fluxcd.io grafana-charts)
           	                  	     	     	Namespace/monitoring created
I realized I missed something in the other files for the repo that wasn’t from Flux’s example. After adding namespace: flux-system to the new files my error changed:
monitoring-controllers False False kustomize build failed: accumulating resources: accumulation err='accumulating resources from './kube-prometheus-stack': read /tmp/kustomization-2571572918/monitoring/controllers/kube-prometheus-stack: is a directory': recursed accumulation of path '/tmp/kustomization-2571572918/monitoring/controllers/kube-prometheus-stack': accumulating resources: accumulation err='accumulating resources from 'namespace.yaml': open /tmp/kustomization-2571572918/monitoring/controllers/kube-prometheus-stack/namespace.yaml: no such file or directory': must build at directory: not a valid directory: evalsymlink failure on '/tmp/kustomization-2571572918/monitoring/controllers/kube-prometheus-stack/namespace.yaml' : lstat /tmp/kustomization-2571572918/monitoring/controllers/kube-prometheus-stack/namespace.yaml: no such file or directory
Looks like some resources were referenced in the controller’s kustomization that were moved because of this weird ass structure we’ve somehow adopted.
Forcing doesn’t help, just gotta wait:
flux reconcile source git flux-system
After a bit everything was sorted and we have healthy pods!!
monitoring             kube-prometheus-stack-grafana-766d9bff99-cgzfn              3/3     Running   0               2m56s
monitoring             kube-prometheus-stack-kube-state-metrics-796f496448-vwnqc   1/1     Running   0               2m56s
monitoring             kube-prometheus-stack-operator-64b54fb9d8-9dfbv             1/1     Running   0               2m56s
monitoring             kube-prometheus-stack-prometheus-node-exporter-87smq        1/1     Running   0               2m56s
monitoring             kube-prometheus-stack-prometheus-node-exporter-dlbr9        1/1     Running   0               2m56s
monitoring             kube-prometheus-stack-prometheus-node-exporter-n5tgt        1/1     Running   0               2m56s
monitoring             kube-prometheus-stack-prometheus-node-exporter-p45cm        1/1     Running   0               2m56s
monitoring             loki-stack-0                                                1/1     Running   0               2m10s
monitoring             loki-stack-promtail-2fnpn                                   1/1     Running   0               2m10s
monitoring             loki-stack-promtail-75zfh                                   1/1     Running   0               2m10s
monitoring             loki-stack-promtail-pgn6k                                   1/1     Running   0               2m10s
monitoring             loki-stack-promtail-smnsk                                   1/1     Running   0               2m10s
monitoring             prometheus-kube-prometheus-stack-prometheus-0               2/2     Running   0               2m51s
WARNING The funky tutorials were great but set me up in a way that the official doc’s now need to be modified. I’d rather not divert from what is most easily googled, even if it’s a better pattern longer term, as I am still working out how to manage everything.
Recap Funky Flux
Just so I don’t have to sift through that nightmare again here’s what I did to convert a Flux example repo to a Funky Flux repo:
- Created a Kustomization file in the
bootstapfolder that defined the “cluster” I was deploying where the “cluster” was one or more kustomizations in the folder specific to this deployment 589e0c7 - Moved anything that created a namespace into
namespaceswhere the creation of each namespace was it’s own file 589e0c7 - Moved anything that added a HelmRepo into
helmrepositorieswhere each repo was in it’s own fine 589e0c7 - Followed the pattern where the shared resources were running under
namespace: flux-systemand then pointed the cluster to this namespace for these resources. This makes sense as I wouldn’t want to duplicate these shared resources for other apps. bef9e39 e7f639c - Made all the intervals in sync with the other clusters bef9e39 10a8802
- Removed references to local resources for things moved to shared resources 994771f
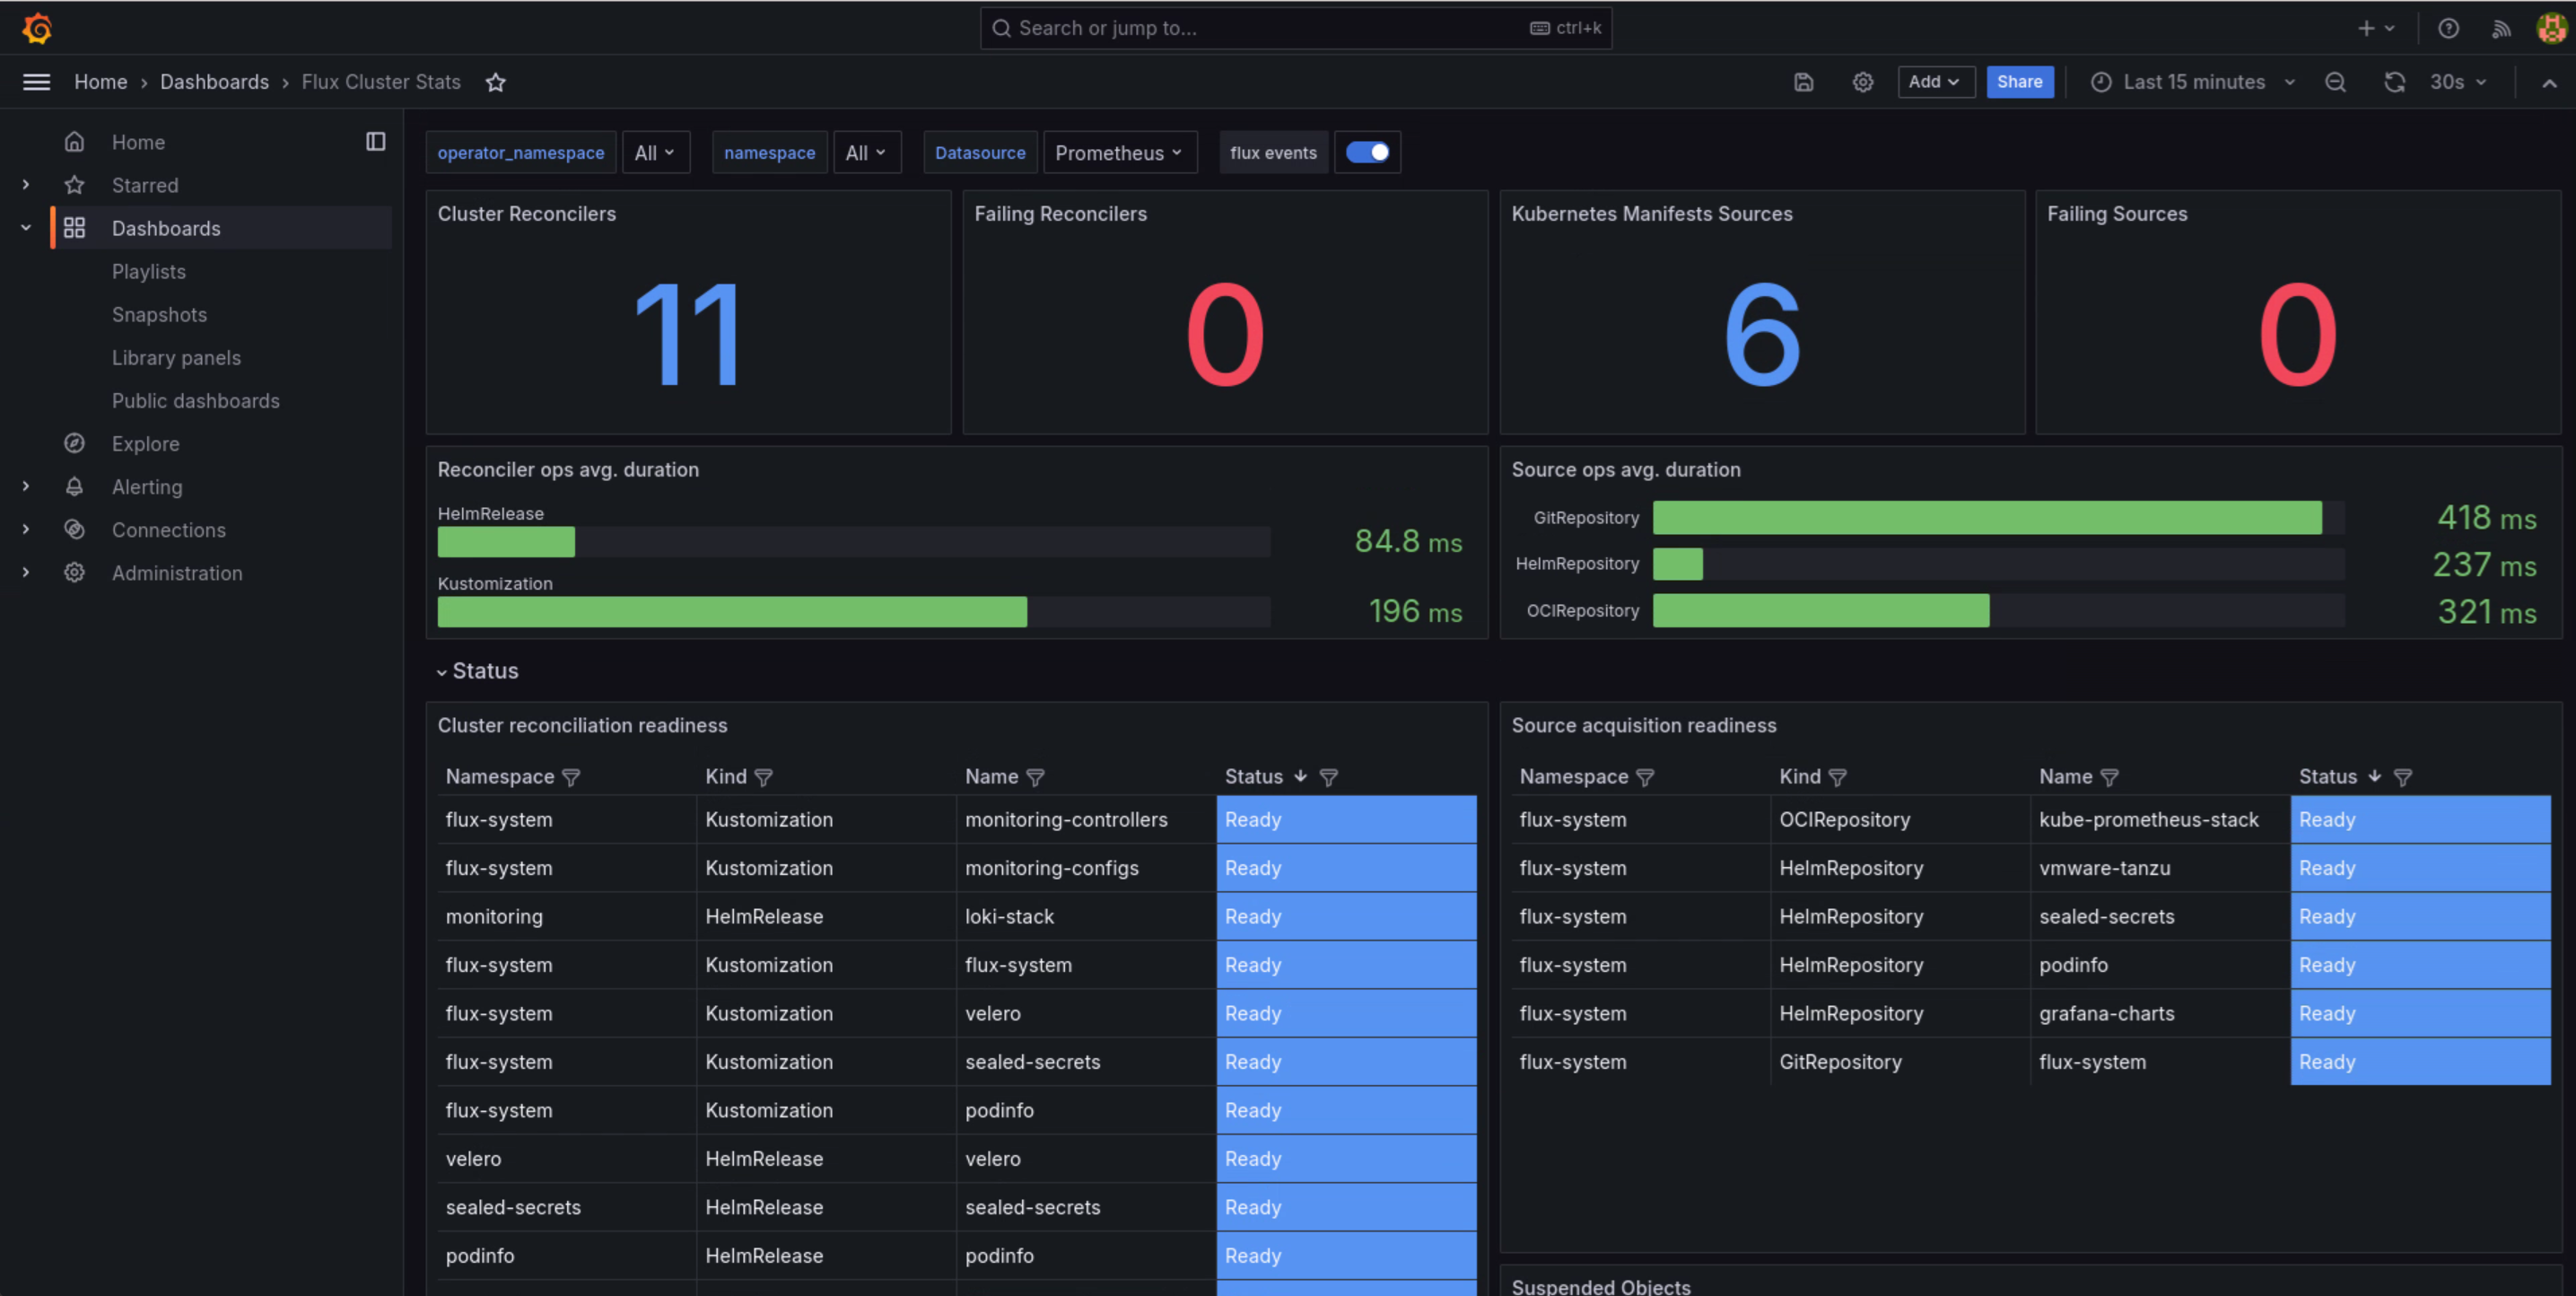
Checking out Grafana
So what did I just install? Not much really, mostly Flux related stuff that I can see from Grafana but this should lay groundwork for adding more next.
Manual Port Forwarding Test
This example didn’t include how to configure port forwarding so I can temporarily access Grafana by holding the port open in a terminal:
kubectl -n monitoring port-forward svc/kube-prometheus-stack-grafana 3000:80
And it worked!
This is cool stuff and there’s plenty of other dashboards to be added but we are here for logs. Fortunately it came with Loki. Unfortunately nothing seems to be making it’s way in there but I don’t really know how much flux logs. Sounds like I should follow along here to get flux logs in there.
Grafana Nodeport
To not have to manually forward the port I was able to define a NodePort for the service in the values.yaml override.
This may not be the best way to do it and I think the funky tutorials may add other tools I can use but it’s working well for now.
    grafana:
      defaultDashboardsEnabled: false
      adminPassword: flux
      service:
        type: NodePort
        port: 80
        containerPort: 8080
        nodePort: 30001
Getting Logs
First I had to ‘patch’ the flux-system kustomization:
apiVersion: kustomize.config.k8s.io/v1beta1
kind: Kustomization
resources:
- .gitkeep
- gotk-components.yaml
- gotk-sync.yaml
patches:
  - patch: |
      - op: add
        path: /spec/template/spec/containers/0/args/-
        value: --log-level="debug"
    target:
      kind: Deployment
      name: "(kustomize-controller|helm-controller|source-controller)"
Actually, I don’t think I had to do that. Something seems wrong with the Flux dashboard, I’m getting all the pod logs in Loki now!
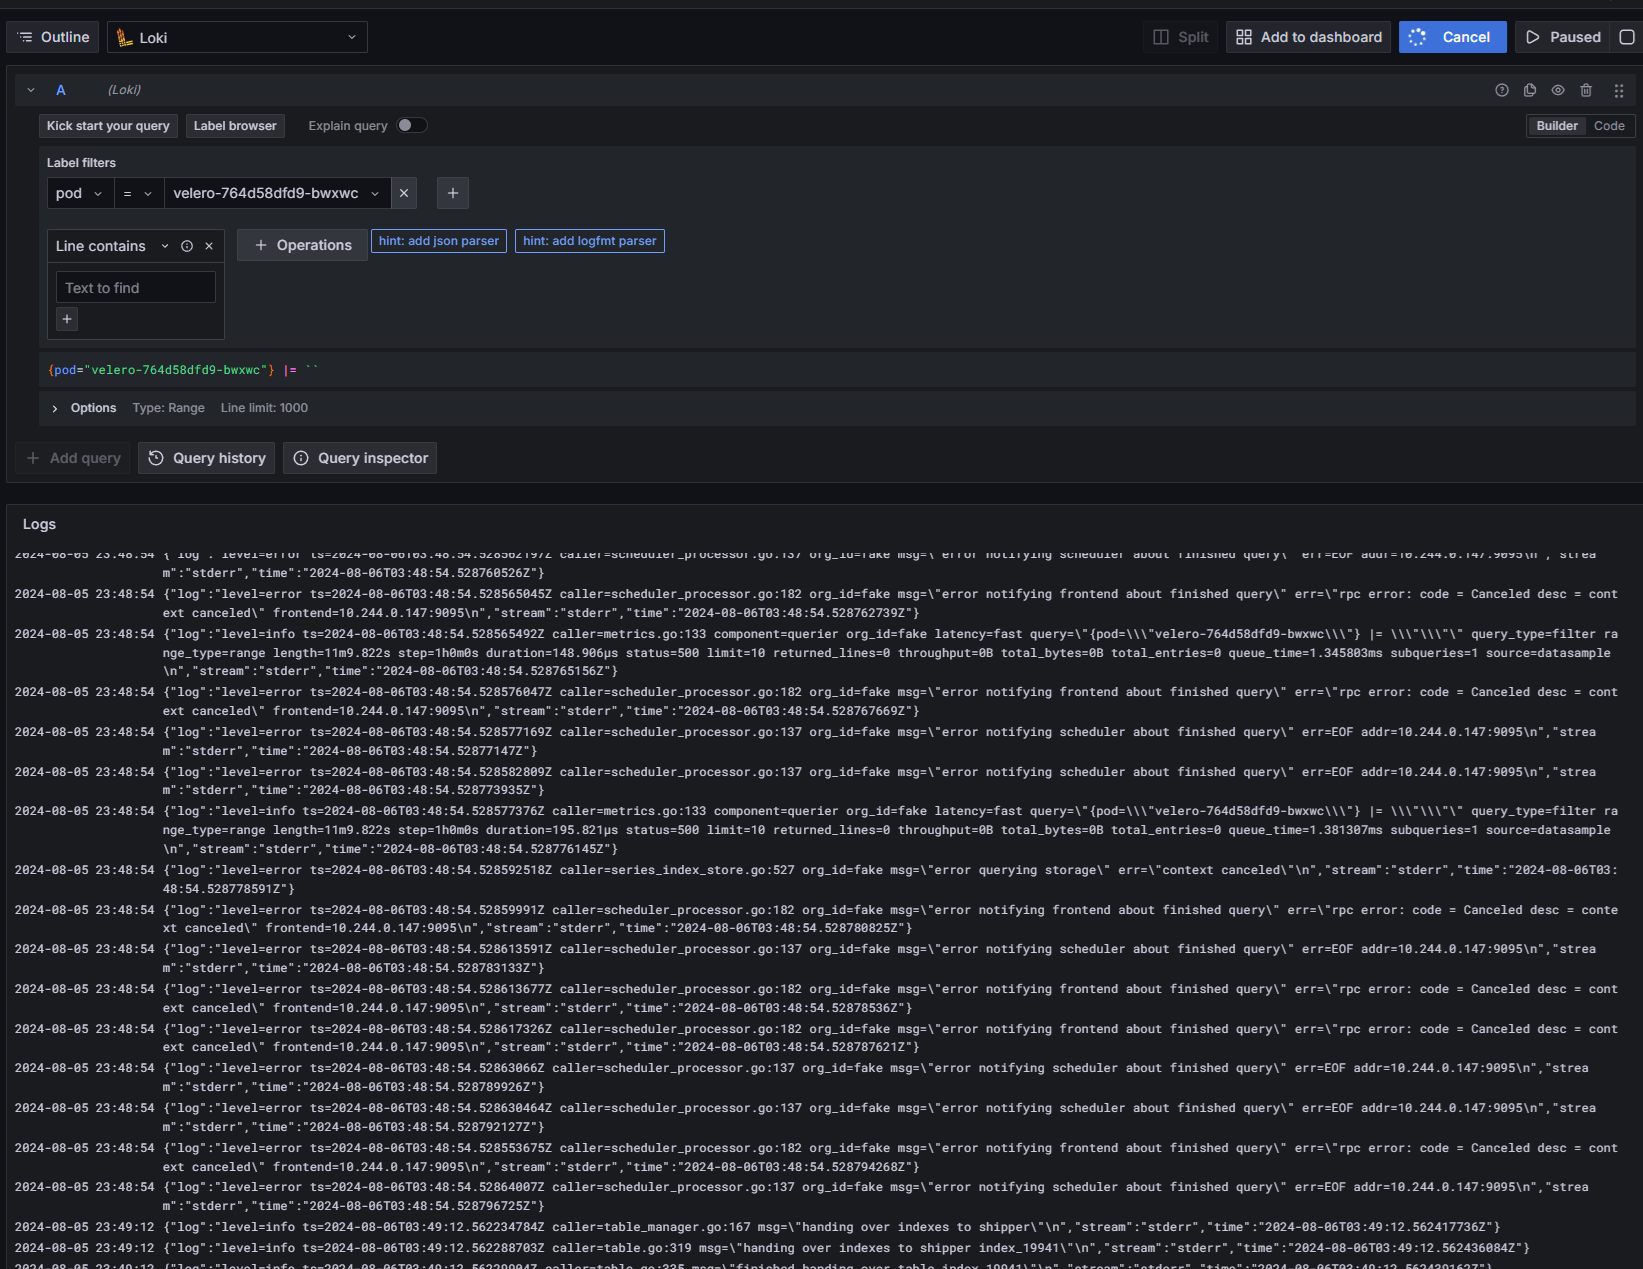
It mostly works!
Fixing the Flux Dashboard
TODO want to fix or delete it
Persisting Logs Beyond The Pod
Right now the logs are still in the pod. They are in the promtail pod and their source pod’s cache. Now we need to get that onto a volume that can survive any pod going down including promtail
TO BE CONTINUED…